
Accounts Receivable Aging Report Analysis: A 2026 Guide to Cash Risk Detection

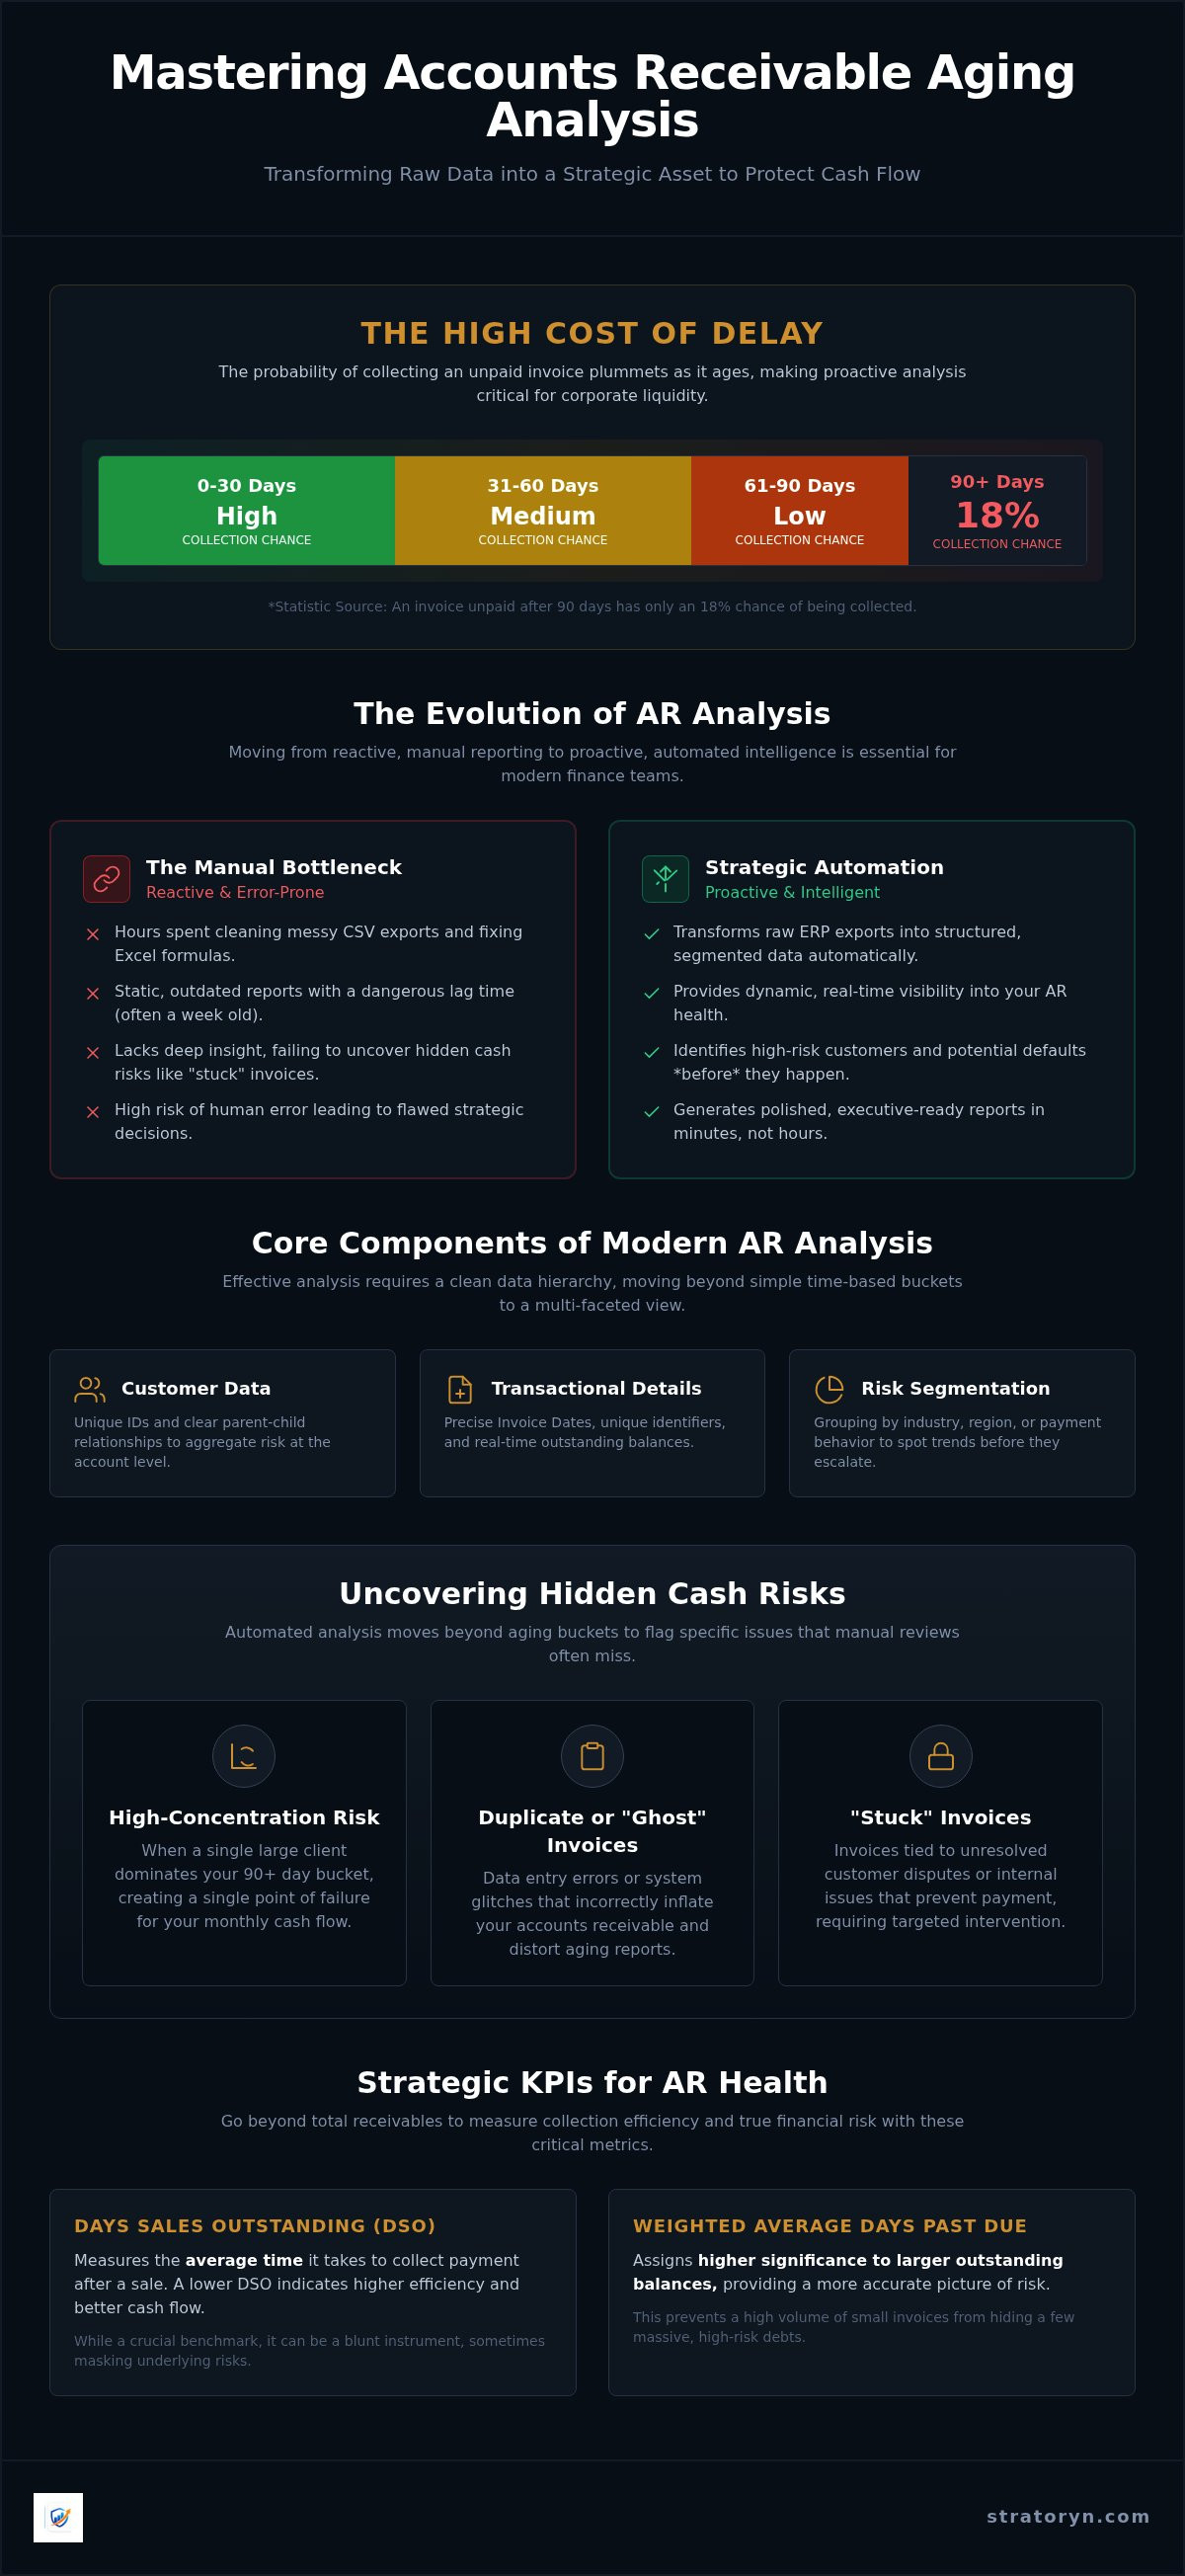
An invoice that remains unpaid for more than 90 days has only an 18% chance of ever being collected. This startling statistic highlights the high stakes of modern debt management. You likely feel the pressure of manual accounts receivable aging report analysis every month. It's frustrating to spend hours cleaning CSV exports and fixing Excel formulas only to produce a static report that lacks deep insight into actual cash risks.
We understand the challenge of presenting polished, executive-ready data when your source files are a mess. This guide promises to help you master the transition from raw ERP exports to actionable intelligence. You'll learn how to identify high-risk customers before they default and use automation to reduce your Days Sales Outstanding (DSO). We will cover everything from the impact of ASU 2025-05 on credit loss estimates to the latest 2026 interest rates for late payments.
By the end of this article, you'll have a clear roadmap for replacing manual data entry with streamlined intelligence. We're moving beyond basic buckets to a sophisticated model of risk detection. Let's look at how you can turn your static aging reports into a strategic asset that protects your company's cash flow.
Key Takeaways
- Move beyond static buckets to a dynamic, risk-aware intelligence model that actively protects your company's liquidity.
- Implement a precise workflow for accounts receivable aging report analysis that transforms raw ERP exports into structured, segmented data.
- Uncover hidden cash risks such as duplicate or "stuck" invoices that often evade traditional manual spreadsheet reviews.
- Generate polished, executive-ready reports in minutes using secure, browser-side automation that requires zero IT integration.
Table of Contents
- What is Accounts Receivable Aging Report Analysis in 2026?
- Structural Components of Effective AR Aging Analysis
- How to Perform an AR Aging Report Analysis: A Step-by-Step Workflow
- Identifying Hidden Cash Risks: Moving Beyond Traditional Aging Buckets
- Automating Executive-Ready AR Reports with Stratoryn
What is Accounts Receivable Aging Report Analysis in 2026?
At its core, Accounts receivable represents the money owed to your business for goods or services delivered. In 2026, accounts receivable aging report analysis has evolved from a routine accounting task into a high-stakes strategic evaluation. It is the process of categorizing unpaid invoices by the length of time they have been outstanding to protect corporate liquidity. This analysis is no longer just about looking at who owes you money; it's about predicting which customers are likely to default before it happens.
The transition from static reporting to dynamic, risk-aware intelligence defines the modern finance department. In previous years, a monthly PDF export was sufficient. Now, the speed of business requires real-time visibility. AR health directly impacts corporate valuation and operational agility. Investors and stakeholders view a bloated aging report as a sign of poor management and high risk. If your cash is tied up in overdue invoices, you lack the capital to pivot, invest, or scale. Efficiency in converting sales to cash is a key performance indicator that executives watch closely.
Despite the importance of this data, manual analysis of ERP exports remains the number one bottleneck for finance teams. Most professionals still find themselves trapped in a cycle of exporting CSV files from systems like SAP or NetSuite, only to spend hours cleaning data and fixing broken Excel formulas. This manual overhead creates a dangerous lag. By the time the report is ready for executive review, the data is often a week old, and the risk has already escalated. Moving toward automated accounts receivable aging report analysis is the only way to maintain a competitive edge.
The Core Components of a Modern Aging Report
A standard report relies on time-based buckets: 0-30, 31-60, 61-90, and 90+ days. While these are essential baselines, they are no longer enough. A robust 2026 analysis requires a clean data hierarchy including unique Customer IDs, precise Invoice Dates, and real-time Outstanding Balances. You must clearly distinguish between "Current" receivables, which are within agreed terms, and "Past Due" liabilities. In 2026, smart teams also layer in segmentation, allowing them to see if specific industries or regions are trending toward late payments before the entire portfolio is affected.
The Strategic Value of Deep AR Analysis
Deep analysis provides the data necessary to adjust credit policies on the fly. If your analysis shows a specific customer segment consistently sliding into the 61-90 day bucket, your current credit terms are likely too generous. This insight also fuels accurate cash flow forecasting. When you know the probability of recovery for each bucket, your projections become reliable. Statistics show that an invoice unpaid after 90 days has only an 18% chance of being paid. High-resolution analysis allows you to prioritize collection efforts on accounts with the highest recovery probability, maximizing your return on effort.
Structural Components of Effective AR Aging Analysis
A high-level accounts receivable aging report analysis requires more than just standard time buckets. It demands a rigorous data hierarchy that separates master data from transactional details. To build an enterprise-grade report, you must align customer parent-child relationships, unique invoice identifiers, and precise payment terms. Without this structure, your analysis will fail to provide the granularity needed for strategic decision-making. High-performing finance teams use these components to transform a simple list of debts into a map of operational health.
Days Sales Outstanding (DSO) serves as your primary KPI for report health. It measures the average time your business takes to collect payment after a sale. However, DSO can be a blunt instrument. To gain a sharper perspective, you must also track the "weighted average days past due." This metric assigns higher significance to larger outstanding balances. It prevents a high volume of small, low-risk invoices from masking a few massive, high-risk liabilities that could threaten your monthly cash position.
Segmenting Data by Risk Profile
Customer segmentation should move beyond basic industry categories. You must group accounts by their actual payment behavior. Identifying "high-concentration" risks is vital. This occurs when a single client dominates your 90+ day bucket, creating a single point of failure for your cash flow. Once you segment by risk, you can set dynamic thresholds for your allowance for doubtful accounts. This ensures your balance sheet reflects the reality of your aging buckets rather than an optimistic estimate. Performing a thorough Data Quality Analysis ensures your segmentation is based on facts rather than flawed exports.
Data Integrity: The Foundation of Analysis
Raw ERP exports are notorious for hidden errors. Duplicates, currency mismatches, and incorrect "Terms" data frequently compromise the accuracy of your aging buckets. If an invoice is marked as Net 30 in your export but is actually Net 60 in your contract, your aging logic will incorrectly flag it as past due. This erodes trust with both customers and executives. Data integrity in AR exports is the absolute accuracy and consistency of transaction records across every customer ID and payment term within the dataset. When your data is clean, your risk profiling becomes an asset rather than a liability.
How to Perform an AR Aging Report Analysis: A Step-by-Step Workflow
Executing a precise accounts receivable aging report analysis requires a methodical approach to data management. The process begins with exporting raw transaction data from your ERP system. Whether you use SAP, NetSuite, or Oracle, you should prioritize CSV or Excel formats to maintain maximum flexibility. This raw export acts as the single source of truth for your current financial position. It's the foundation upon which all subsequent risk assessments are built.
Once you have the data, you must cleanse it to ensure consistency. This involves standardizing date formats and verifying customer IDs across all entries. Data quality issues in CSV exports frequently lead to incorrect aging calculations. After cleansing, you can categorize invoices into aging buckets using a standard or customized framework. This step allows you to see exactly where your capital is tied up. From here, you calculate key metrics like Days Sales Outstanding (DSO) and the Collection Effectiveness Index (CEI) to measure your team's performance. Finally, you identify anomalies and high-risk outliers that require immediate intervention.
Extracting and Preparing ERP Data
Best practices for exporting AR data involve selecting comprehensive fields to avoid data truncation. Ensure you include the invoice date, due date, original amount, and remaining balance. Standardizing date formats is critical; inconsistent formats will break the mathematical logic of your age calculations. If you operate globally, pay close attention to multi-currency exports. You must normalize these balances to a single reporting currency to prevent balance distortion in your final accounts receivable aging report analysis.
Analyzing Patterns and Trends
Effective analysis goes beyond the current month. You should compare your current aging against historical benchmarks to identify Month-over-Month (MoM) shifts. Look for "slow-pay" trends where a customer's payment timing gradually extends. These behaviors often precede "no-pay" defaults. By using automated financial risk detection, you can flag these deteriorating behaviors instantly. This proactive stance allows you to adjust credit limits or pause shipments before a minor delay becomes a total loss.
Identifying Hidden Cash Risks: Moving Beyond Traditional Aging Buckets
Traditional 0-30 or 60-90 day buckets provide a historical snapshot. They do not reveal the operational friction that creates genuine cash risk. A sophisticated accounts receivable aging report analysis must dig deeper into data anomalies that distort your financial health. Duplicate invoices are a prime example. These records artificially inflate your receivables, leading to inaccurate forecasting and potential tax implications. When your asset totals are wrong, your entire liquidity strategy is compromised.
You must also identify "stuck" invoices. These transactions remain open due to data entry errors or ERP migration glitches. They often represent revenue that has already been collected but not reconciled, or invoices that were never properly delivered to the customer. Unusual payment patterns require immediate attention. If a historically prompt payer starts oscillating between 10 and 25 days, they are signaling internal liquidity stress. You should also watch for credit limit breaches hidden within the aging report. A customer might be "current" in their buckets but has exceeded their total credit capacity, indicating a high risk of future default that standard aging misses.
Surface Hidden Data Quality Issues
Data integrity is often compromised during system transitions. Using erp migration data quality tools helps you identify these errors before they pollute your reporting. A common issue is a mismatch between the General Ledger (GL) and the AR sub-ledger. This discrepancy indicates that your high-level financial statements do not reflect your actual customer transactions. You should also audit for "orphan" credits. These are unapplied payments or credit memos that linger in your system, masking the true amount a customer owes. To resolve these inconsistencies, you can utilize our Data Quality Analysis to scrub your exports for errors.
Predictive Risk Indicators
Modern finance teams are shifting from descriptive analysis to predictive intelligence. Stop asking what happened last month and start asking what will happen next month. AI scoring models evaluate customer risk based on payment timing volatility rather than just overdue totals. AI identifies "payment decay" by detecting subtle, incremental delays in payment timing that signal a customer's deteriorating liquidity before a total default occurs. This foresight allows you to prioritize collections based on risk rather than just balance size. By flagging these indicators early, you transform your accounts receivable aging report analysis into a proactive shield for your company's cash flow.
Automating Executive-Ready AR Reports with Stratoryn
Manual accounts receivable aging report analysis is a significant drain on finance resources. Stratoryn solves this by providing a streamlined ERP Intelligence Workspace designed for speed and precision. Instead of fighting with Excel formulas, you simply upload your raw CSV or Excel exports. Our platform acts as the bridge between fragmented data and executive-level strategy. It identifies the hidden cash risks we've discussed, such as duplicates and payment decay, without requiring a single hour of IT integration.
The core advantage of our system is browser-side processing. This ensures your data never leaves your local environment, providing a layer of security that traditional cloud tools can't match. You get the power of an AI-driven analysis with the privacy of a local spreadsheet. It's a frictionless way to move from raw transaction logs to a polished, authoritative summary that's ready for the boardroom. You'll generate high-impact insights in minutes rather than days.
From Raw CSV to Management Insight
Our ERP Intelligence Workspace eliminates the need for manual data cleansing. Whether you're exporting from NetSuite, SAP, or Sage, the system automatically detects data types and flags inconsistencies. It moves beyond simple risk detection to highlight "Opportunities" within your ledger. This includes identifying where you can optimize credit terms or reallocate collection resources to high-probability accounts. You stop being a data processor and start functioning as a strategic advisor.
Security and Efficiency for Finance Teams
We understand that data privacy is non-negotiable for finance professionals. Stratoryn doesn't store your raw files on any server; all processing happens locally in your browser. This methodology allows you to maintain total control over your sensitive financial information while benefiting from advanced automation. Currently, you can take advantage of our "Early Access" program to build your AR strategy at no cost. Don't let manual reporting slow your growth. Analyze your first AR export with Stratoryn today and secure your company's liquidity with confidence.
Securing Your Cash Flow with Automated Intelligence
Mastering your accounts receivable aging report analysis is no longer a luxury. It's a fundamental requirement for maintaining liquidity in 2026. You've seen how manual data cleanup and static reporting create dangerous blind spots in your financial oversight. By shifting to a model that prioritizes data integrity and predictive risk scoring, you protect your company from the high default rates associated with aging debt. The transition from raw ERP data to executive-ready insight should take minutes, not days.
Stratoryn provides the tools you need to bridge this gap. Our ERP Intelligence Workspace offers no-integration AI analysis that highlights hidden risks while maintaining absolute browser-side data security. You don't have to wait for IT approval or overhaul your existing systems to start seeing results. Leverage our early-access free workspace to refine your collection strategy and reduce your DSO immediately. It's time to stop processing files and start driving strategy.
Transform your AR exports into executive-ready reports with Stratoryn. Take the first step toward a more resilient and transparent finance department today.
Frequently Asked Questions
What is the most important metric in an accounts receivable aging report?
Days Sales Outstanding (DSO) is the most critical metric because it measures the average time required to convert sales into cash. While DSO provides a high-level view of collection efficiency, tracking weighted average days past due adds necessary context by highlighting high-value risks. These metrics together ensure that your accounts receivable aging report analysis focuses on liquidity impact rather than just total invoice counts.
How often should a finance team perform an AR aging report analysis?
You should perform this analysis at least monthly to align with standard financial closing cycles. High-volume enterprises or businesses with tight margins often benefit from weekly reviews to catch deteriorating payment patterns early. Real-time visibility is the standard in 2026. Frequent checks allow your team to adjust credit holds and collection priorities before minor delays escalate into significant cash flow gaps.
Can I perform AR aging analysis in Excel without specialized software?
You can perform analysis in Excel, but it creates significant manual overhead and high risks of formula errors. Manual spreadsheet work often results in static data that's outdated by the time you finish cleaning the CSV export. Specialized tools automate the transition from raw data to insight, ensuring your accounts receivable aging report analysis is accurate and ready for executive review without the risk of broken links.
What are the most common data errors in ERP accounts receivable exports?
The most common errors include duplicate invoice entries, inconsistent date formats, and mismatched customer parent-child IDs. ERP exports often struggle with multi-currency normalization, which can distort the total balance in your aging buckets. These errors compromise the integrity of your report. Identifying these data quality issues early is essential to ensure your risk assessments reflect the actual state of your ledger and cash position.
How do I handle unapplied credits in an AR aging report?
Unapplied credits should be netted against outstanding balances or matched to specific invoices immediately to avoid inflating your receivables. If left unmanaged, these "orphan" credits make a customer's account look more delinquent than it actually is. Regular reconciliation ensures your aging report accurately reflects the net amount owed. This practice prevents awkward collection calls to customers who have already paid or hold valid credit memos.
What is the difference between AR aging and AP aging analysis?
AR aging tracks the money customers owe your business, while AP aging tracks the money your business owes to vendors. AR analysis focuses on maximizing cash inflows and minimizing credit risk. AP analysis focuses on managing cash outflows and maintaining vendor relationships. Both are essential for a complete view of working capital, but AR aging is the primary driver for protecting liquidity and operational cash flow.
How does AR aging analysis impact a company’s credit rating?
Consistently high past-due balances in your aging report can negatively impact your company's credit rating and borrowing capacity. Lenders and credit agencies view a bloated aging report as evidence of poor working capital management or high customer default risk. Maintaining a healthy, low-DSO ledger demonstrates operational efficiency. This transparency often leads to better financing terms and increased confidence from external stakeholders and investors.
How can AI improve the accuracy of my aging report analysis?
AI improves accuracy by identifying subtle patterns in payment behavior that manual reviews miss. It can detect "payment decay" by analyzing tiny shifts in payment timing over multiple months. AI also automates the detection of data quality issues like duplicates or system-generated errors in ERP exports. This predictive capability moves your team from reacting to past defaults to preventing future losses through automated risk scoring models.
Frequently asked questions
What is the most important metric in an accounts receivable aging report?
Days Sales Outstanding (DSO) is the most critical metric because it measures the average time required to convert sales into cash. While DSO provides a high-level view of collection efficiency, tracking weighted average days past due adds necessary context by highlighting high-value risks. These metrics together ensure that your accounts receivable aging report analysis focuses on liquidity impact rather than just total invoice counts.
How often should a finance team perform an AR aging report analysis?
You should perform this analysis at least monthly to align with standard financial closing cycles. High-volume enterprises or businesses with tight margins often benefit from weekly reviews to catch deteriorating payment patterns early. Real-time visibility is the standard in 2026. Frequent checks allow your team to adjust credit holds and collection priorities before minor delays escalate into significant cash flow gaps.
Can I perform AR aging analysis in Excel without specialized software?
You can perform analysis in Excel, but it creates significant manual overhead and high risks of formula errors. Manual spreadsheet work often results in static data that's outdated by the time you finish cleaning the CSV export. Specialized tools automate the transition from raw data to insight, ensuring your accounts receivable aging report analysis is accurate and ready for executive review without the risk of broken links.
What are the most common data errors in ERP accounts receivable exports?
The most common errors include duplicate invoice entries, inconsistent date formats, and mismatched customer parent-child IDs. ERP exports often struggle with multi-currency normalization, which can distort the total balance in your aging buckets. These errors compromise the integrity of your report. Identifying these data quality issues early is essential to ensure your risk assessments reflect the actual state of your ledger and cash position.
How do I handle unapplied credits in an AR aging report?
Unapplied credits should be netted against outstanding balances or matched to specific invoices immediately to avoid inflating your receivables. If left unmanaged, these "orphan" credits make a customer's account look more delinquent than it actually is. Regular reconciliation ensures your aging report accurately reflects the net amount owed. This practice prevents awkward collection calls to customers who have already paid or hold valid credit memos.
What is the difference between AR aging and AP aging analysis?
AR aging tracks the money customers owe your business, while AP aging tracks the money your business owes to vendors. AR analysis focuses on maximizing cash inflows and minimizing credit risk. AP analysis focuses on managing cash outflows and maintaining vendor relationships. Both are essential for a complete view of working capital, but AR aging is the primary driver for protecting liquidity and operational cash flow.
How does AR aging analysis impact a company’s credit rating?
Consistently high past-due balances in your aging report can negatively impact your company's credit rating and borrowing capacity. Lenders and credit agencies view a bloated aging report as evidence of poor working capital management or high customer default risk. Maintaining a healthy, low-DSO ledger demonstrates operational efficiency. This transparency often leads to better financing terms and increased confidence from external stakeholders and investors.
How can AI improve the accuracy of my aging report analysis?
AI improves accuracy by identifying subtle patterns in payment behavior that manual reviews miss. It can detect "payment decay" by analyzing tiny shifts in payment timing over multiple months. AI also automates the detection of data quality issues like duplicates or system-generated errors in ERP exports. This predictive capability moves your team from reacting to past defaults to preventing future losses through automated risk scoring models.
- accounts receivable aging report analysis
- Accounts Receivable
- Aging Report
- Cash Flow Management
- Risk Detection
- DSO
- AR Automation
- Financial Reporting
- Credit Management
- cash risk detection
- reduce DSO
- AR automation
- credit loss estimates
- debt management
- financial reporting