
Accounts Payable Data Analysis in Excel: A 2026 Guide to Faster Insights

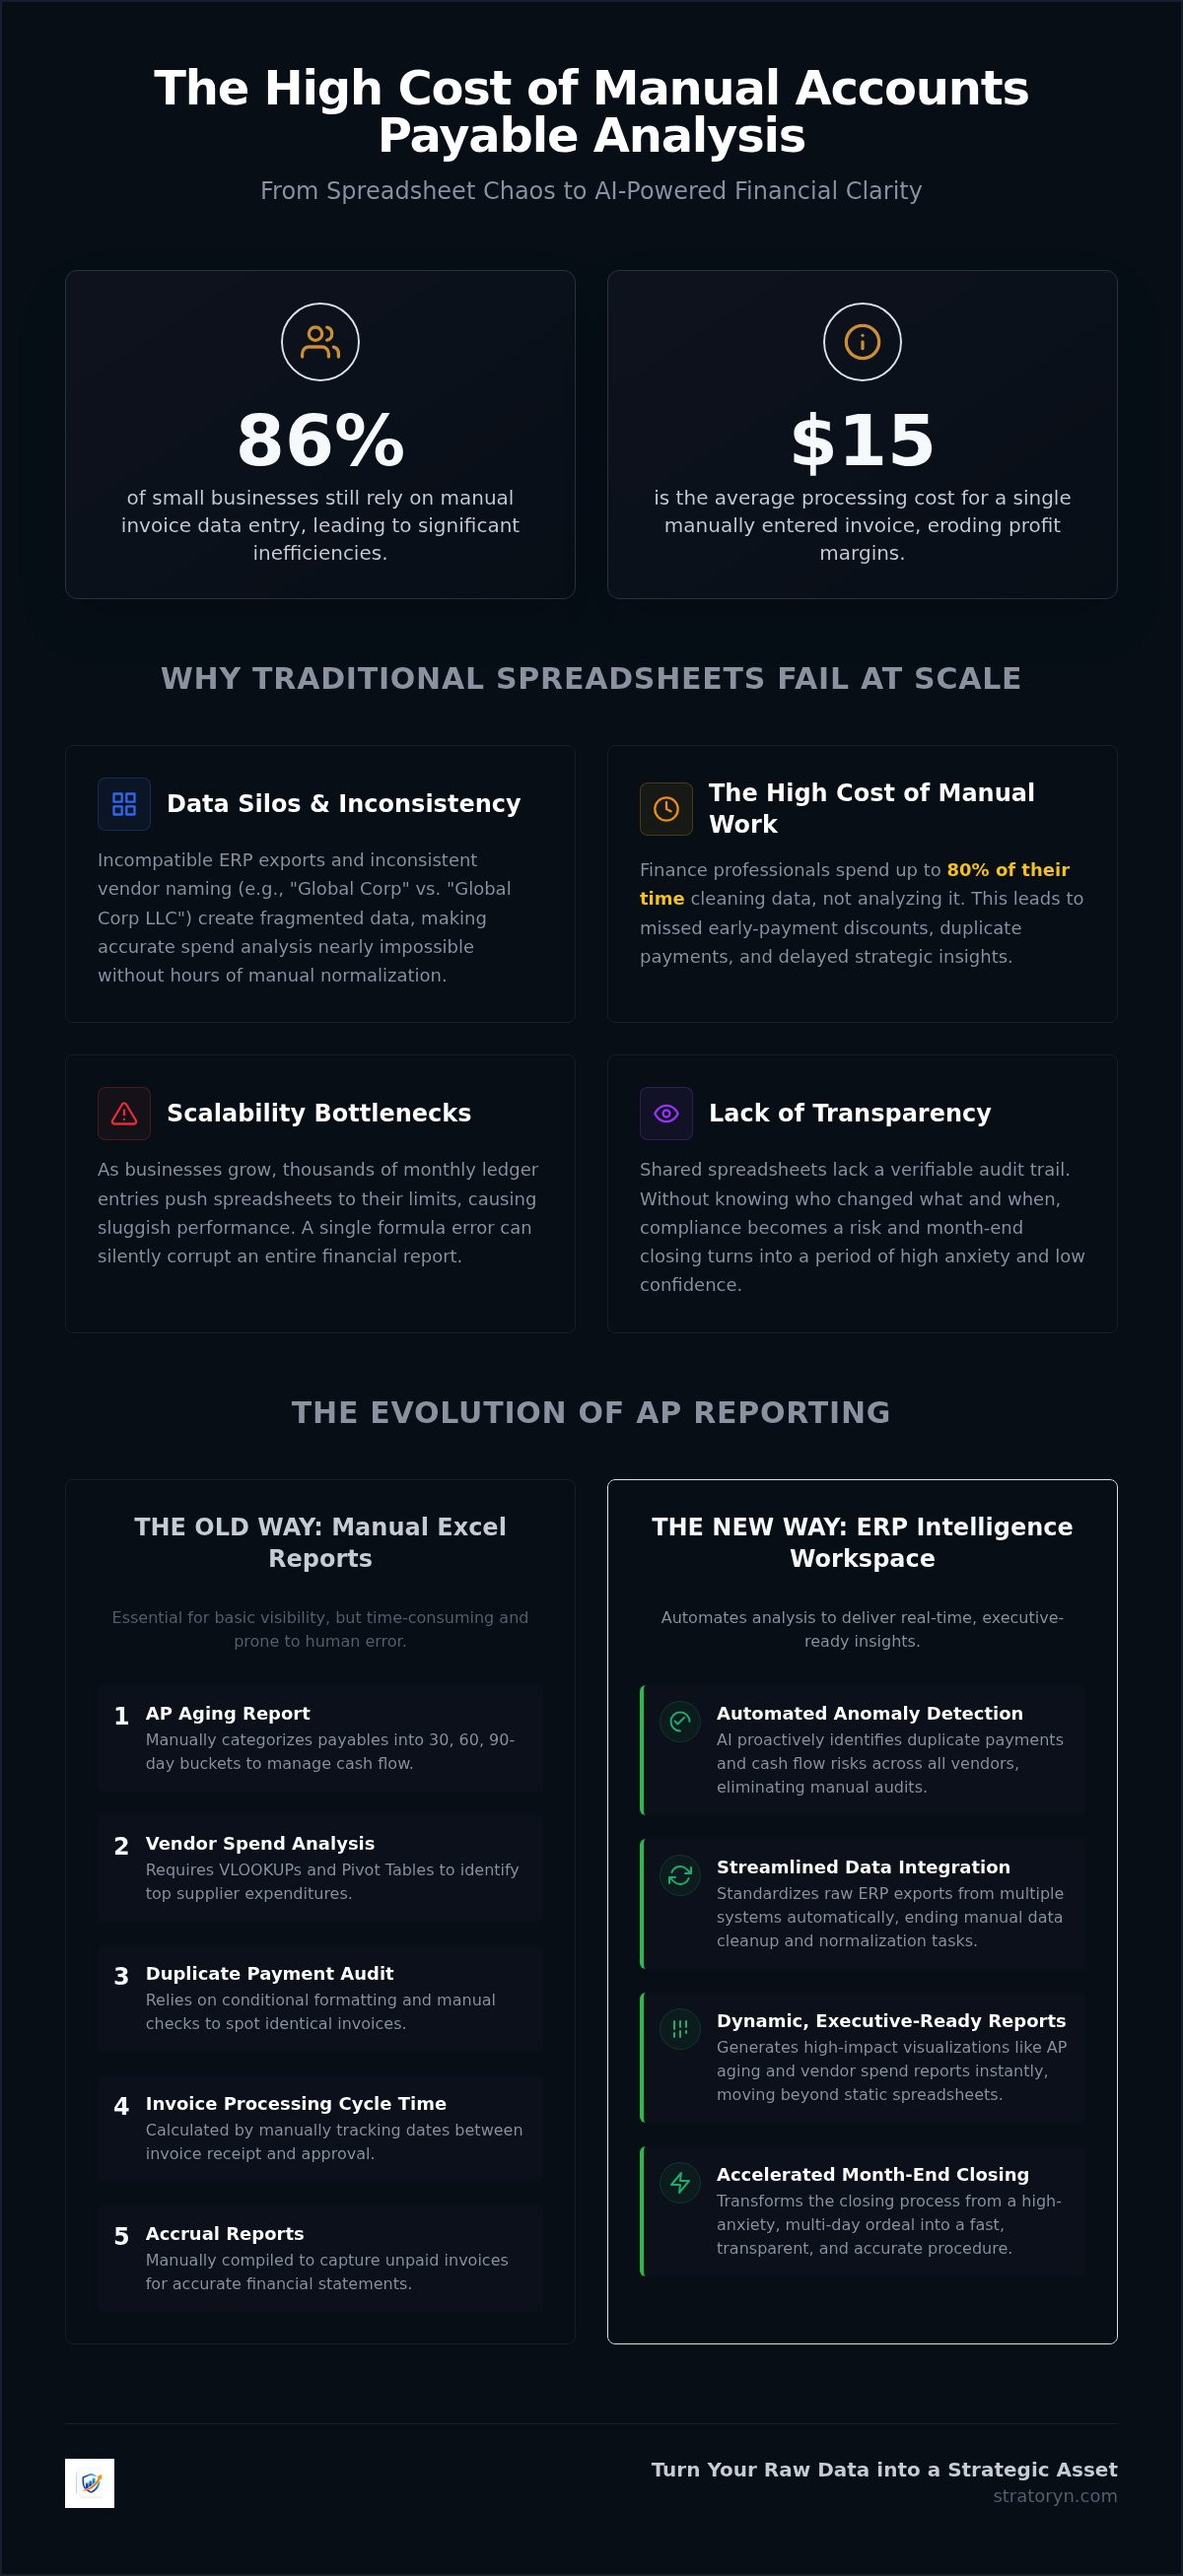
Recent 2026 research reveals that 86% of small businesses still manually enter invoice data, a process that costs an average of $15 per invoice. You likely feel the weight of this inefficiency every time you open a spreadsheet. You're wrestling with inconsistent ERP exports and spending hours cleaning up vendor duplicates. Mastering accounts payable data analysis in excel shouldn't feel like a full-time job. It's frustrating when manual formula errors lead to incorrect financial reporting, especially when you're under pressure to close the books. You deserve a process that works as fast as you do.
This guide shows you how to transform raw CSV exports into actionable financial insights using modern Excel features and AI-driven alternatives. We'll explore how to identify duplicate payments and mitigate cash flow risks with total precision. You'll learn to move beyond basic VLOOKUPs to a streamlined ERP Intelligence Workspace that delivers executive-ready reports. By the end of this article, you'll have a clear roadmap to accelerate your month-end closing and gain the visibility your leadership team demands. It's time to turn your raw data into a strategic asset.
Key Takeaways
- Build high-impact AP aging and vendor spend reports to visualize liabilities and supplier trends.
- Streamline your accounts payable data analysis in excel by standardizing raw ERP exports and eliminating manual cleanup tasks.
- Identify the hidden security risks and scalability bottlenecks that occur when managing financial ledger data in local spreadsheets.
- Leverage an AI Data Analyst to automate the detection of duplicate payments and cash flow risks across your entire vendor list.
- Accelerate month-end closing by transitioning from manual formulas to an ERP Intelligence Workspace that generates executive-ready reports.
Table of Contents
- The Challenges of Manual Accounts Payable Data Analysis in Excel
- 5 Essential Accounts Payable Reports You Can Build in Excel
- Step-by-Step: Analyzing AP Data Exports with Excel Formulas
- Excel vs. AI: Why Traditional Spreadsheets Fail at Scale
- Beyond the Spreadsheet: Generating Executive-Ready AP Reports with Stratoryn
The Challenges of Manual Accounts Payable Data Analysis in Excel
Manual data entry is the silent killer of productivity in modern finance departments. When you rely on accounts payable data analysis in excel, you're often fighting the tool rather than analyzing the numbers. Reporting delays aren't just a nuisance. They're a symptom of a process built on fragile foundations. Every minute spent re-keying data or fixing a broken cell is a minute lost to high-level strategy.
Excel starts to struggle as your business scales. Most ERP systems generate thousands of ledger entries every month, pushing traditional spreadsheets to their breaking point. As row counts grow, the software becomes sluggish and unresponsive. A single calculation error in row 5,000 can propagate through your entire workbook. These mistakes often remain undetected until a major discrepancy appears in the final balance sheet during month-end closing. It's a liability you can't afford.
Transparency is another significant hurdle. Traditional shared spreadsheets lack a verifiable audit trail. In a high-stakes Accounts payable (AP) environment, knowing who modified a cell and why is critical for compliance. Without this history, your month-end closing becomes a period of high anxiety and low transparency. You're left guessing which version of the truth is actually the latest one.
Data Silos and ERP Export Inconsistency
Different ERP systems format data in unique, often incompatible ways. If your organization uses SAP for one division and Dynamics for another, consolidating that data is a logistical nightmare. You've likely dealt with VLOOKUPs that break the moment a column header shifts or a file name changes. Inconsistent vendor naming is another major hurdle. One system might list a supplier as "Global Corp," while another uses "Global Corporation LLC." This fragmentation makes accurate spend analysis impossible without hours of manual normalization. It's tedious, repetitive work that adds no value to the bottom line.
The High Cost of Manual Oversight
Finance professionals often spend up to 80% of their time cleaning data rather than interpreting it. This manual oversight is expensive and prone to human error. Common risks, such as duplicate payments or missed early-payment discounts, often slip through the cracks of a standard spreadsheet. Creating executive ready management reports requires more than just raw numbers. It requires a level of synthesis that manual accounts payable data analysis in excel simply cannot provide at scale. You end up with a static snapshot that's outdated the moment you hit save. Your leadership team needs real-time clarity, not a history lesson from last week's CSV export.
5 Essential Accounts Payable Reports You Can Build in Excel
Effective accounts payable data analysis in excel transforms raw ledger entries into a strategic roadmap. You can't manage what you don't measure. By building these five core reports, you gain immediate visibility into your cash outflows and operational bottlenecks. These tools move you away from reactive fire-fighting toward proactive financial management.
- AP Aging Report: This is your primary tool for cash flow management. It categorizes what you owe into 30, 60, and 90-day buckets.
- Vendor Spend Analysis: Focus on your top 10 suppliers to see where the majority of your capital is going.
- Duplicate Payment Audit: Use Excel's conditional formatting to highlight identical invoice numbers or amounts.
- Invoice Processing Cycle Time: Track the duration between receiving an invoice and its final approval.
- Accrual Reports: Capture all received but unpaid invoices to ensure your month-end financial statements are accurate.
Understanding these reports is essential for mastering the accounts payable process and ensuring your department remains a value center rather than a cost center.
Visualizing Your AP Aging Bucket
Pivot Tables are the most efficient way to organize your aging data. Import your CSV export and group the "Document Date" field by month. You should then create a calculated field to determine "Days Overdue" by subtracting the due date from today's date. This view helps you prioritize payments and avoid costly late fees. To go further, consider how automated financial risk detection can flag vendors with high delinquency rates before they impact your corporate credit score.
Vendor Concentration and Spend Visibility
High vendor concentration can be a risk or an opportunity. Use the "Top 10" filter within a Pivot Table to isolate your largest suppliers by total volume. Calculate the percentage of total spend per vendor to understand your dependency levels. This visibility is the first step toward successful procurement negotiations. If you find that 80% of your spend is concentrated in just three vendors, you have significant leverage for better terms. For teams handling thousands of lines, an AI Data Analyst can automate this categorization in seconds, removing the manual pivot table setup entirely.
Measuring the gap between invoice receipt and approval reveals exactly where your workflow is stalling. Is the delay in the mailroom or on an executive's desk? Finally, accrual reports ensure that liabilities are recognized in the correct period. This prevents "surprises" in the following month's budget. These five reports provide the foundation for professional accounts payable data analysis in excel, giving you the clarity needed for executive-level reporting.
Step-by-Step: Analyzing AP Data Exports with Excel Formulas
Actionable accounts payable data analysis in excel begins with a clean export from your system of record. Whether you use SAP, NetSuite, or Dynamics, you should always export your AP ledger as a CSV file. This format provides the most flexibility for data manipulation without the formatting bloat of native Excel files. Once you have your raw data, the first step is to remove blank rows and standardize your date columns to a universal YYYY-MM-DD format. Consistency at this stage prevents calculation errors in your final report.
Merging your transaction list with vendor master data is the next critical phase. While VLOOKUP is the traditional choice, XLOOKUP is more resilient to column shifts and provides a simpler syntax for error handling. Use this function to pull in vendor payment terms or tax IDs. Once your dataset is enriched, apply Pivot Tables to summarize total payables by status and department. This allows you to see exactly where your liabilities are concentrated. Finally, dedicate a separate tab to a dashboard. Use dynamic charts to provide executive-level visibility into your aging buckets and spend trends.
Cleaning ERP Data Quality Issues
The TRIM function is essential because it removes leading or trailing hidden spaces in vendor names that would otherwise cause your lookup formulas to fail. If your CSV export presents dates as text strings, use the "Text to Columns" feature under the Data tab to convert them into a recognizable date format. Addressing these foundational errors is the only way to improve erp data integrity before you begin your analysis. High-quality output requires high-quality input.
Advanced Logic for AP Auditing
Basic math isn't enough for a modern finance team. You need logical tests to identify risks. You can use the IF and AND functions to flag any invoice that exceeds a specific dollar threshold or falls outside of standard payment terms. This creates an immediate exception report for management review. To catch errors before they result in cash loss, set up a "Check for Duplicates" column. A simple COUNTIF formula can scan your invoice numbers and flag any value that appears more than once. You should also automate the calculation of early-payment discount opportunities. By subtracting the invoice date from the discount deadline, you can visualize exactly how much capital you're leaving on the table each month. These advanced steps elevate your accounts payable data analysis in excel from basic record-keeping to strategic oversight.
Excel vs. AI: Why Traditional Spreadsheets Fail at Scale
Excel remains a cornerstone of corporate finance. However, accounts payable data analysis in excel becomes a significant liability as your ledger scales. Spreadsheets are inherently static. They capture a single moment in time. AI offers a dynamic alternative. It processes information in real-time. It identifies shifts in vendor behavior without human intervention. You no longer have to wait for a manual refresh to see your true financial position.
Formula maintenance acts as a hidden tax on your productivity. You likely spend hours auditing your own logic to ensure nothing broke during a recent data import. Automated risk detection removes this burden entirely. It replaces fragile cell references with intelligent algorithms that don't break. These systems do more than report what happened. They explain why it happened. By implementing ai for data quality management, you surface anomalies that a human analyst would miss in a sea of ten thousand rows. For example, identifying non-compliant ACH descriptions required by 2026 Nacha rules is nearly impossible with basic filters. AI handles this effortlessly.
The Security and Privacy Gap
Local spreadsheets represent a major security vulnerability. Storing raw financial data on individual hard drives or shared network folders exposes your organization to data leaks. If a device is compromised, your vendor bank details and internal payment history are at risk. Modern tools prioritize data privacy by utilizing browser-side processing. This approach ensures your data is analyzed within your secure browser session. It eliminates the need for raw file storage on third-party servers. You gain the deep insights of a high-powered analyst without sacrificing the security of your financial records.
Speed to Insight: Minutes vs. Hours
Manual tracking is inherently slow. It can take an entire afternoon to identify which department is responsible for a month-end approval bottleneck. AI identifies these delays instantly. It scans the timestamps of your ERP exports to pinpoint exactly where the workflow has stalled. This shift moves your team from descriptive reporting to predictive cash flow forecasting. You can anticipate a liquidity crunch weeks before it affects your operations. Stop wrestling with manual spreadsheets. Use an ERP Intelligence Workspace to gain executive-level clarity in minutes rather than days.
Beyond the Spreadsheet: Generating Executive-Ready AP Reports with Stratoryn
Excel is a powerful starting point. It is not the finish line. Manual accounts payable data analysis in excel often leaves you trapped in a cycle of data cleaning and formula troubleshooting. You need a way to bridge the gap between raw exports and strategic decisions. The Stratoryn ERP Intelligence Workspace serves as this bridge. It transforms your static CSV files into dynamic, AI-powered financial intelligence. You don't need a background in data science to generate high-level insights. You just need your data.
IT bottlenecks often prevent finance teams from adopting new tools. Stratoryn eliminates this hurdle with a "No Integration" approach. You don't have to wait months for a direct ERP connection or specialized software installation. Simply upload your standard CSV or Excel export. The platform immediately begins processing the information. It recognizes your unique ledger structure and maps your data types automatically. This speed allows you to move from raw information to polished Executive-Ready Reports in minutes.
Automated Risk and Opportunity Detection
The platform functions as a dedicated AI Data Analyst for your accounts payable department. It scans every transaction to flag duplicate invoices and data quality gaps that manual filters often miss. It identifies cash flow risks hidden deep within your ledger entries, such as unusual vendor payment patterns or missed discount windows. Using an ai tool to analyze erp exports provides a level of depth that traditional spreadsheets cannot match. You gain total visibility into your liabilities without writing a single line of code. This automation ensures your Data Quality Analysis is always current.
Getting Started with Early Access
Modern finance professionals value their time. Stratoryn respects that requirement by streamlining the reporting process. You can move from a raw CSV file to a polished, executive-ready report in just three clicks. This efficiency allows you to focus on strategy rather than spreadsheet maintenance. We're currently offering a free early-access SaaS phase for finance teams who want to modernize their operations. It's a frictionless way to experience the future of data management. Analyze your AP data for free with Stratoryn and reclaim your month-end closing cycle.
Accelerate Your Financial Visibility
Mastering accounts payable data analysis in excel remains a foundational skill for any modern finance professional. You now understand how to build core reports and standardize raw ledger exports to drive better insights. But manual formula maintenance shouldn't be your final destination. Transitioning toward dynamic analysis allows your team to prioritize strategic cash flow management over repetitive data entry.
You don't need to wait for IT resources or complex direct integrations to modernize your workflow. Stratoryn offers a streamlined solution. Our ERP Intelligence Workspace uses browser-side processing to maintain maximum privacy for your sensitive financial data. It provides automated risk and opportunity detection, generating Executive-Ready Reports in minutes without the need for manual cleanup.
Take the first step toward a faster month-end closing today. You can start your free AI-powered AP analysis with Stratoryn without any operational friction. It's time to replace manual data cleaning with intelligent automation. You're ready to lead your department with total clarity and confidence.
Frequently Asked Questions
How do I identify duplicate invoices in an Excel AP export?
You identify duplicate invoices by applying Conditional Formatting to the Invoice Number column. Select your data, navigate to Highlight Cell Rules, and choose Duplicate Values to flag matches instantly. For a more precise audit, use a COUNTIF formula to check for rows where both the vendor ID and invoice amount are identical. Manual checks often fail when invoice numbers have slight variations, so look for patterns rather than exact matches.
What are the most important AP metrics to track in a spreadsheet?
Focus on AP Aging, Vendor Spend Concentration, and Invoice Cycle Time. These metrics provide a clear view of your current liabilities and operational efficiency. You should also monitor your duplicate payment rate to prevent capital leakage. Effective accounts payable data analysis in excel requires a balance between descriptive history and actionable risk metrics that inform your cash flow strategy.
Can I use Excel to calculate accounts payable turnover ratio?
Yes, you calculate the accounts payable turnover ratio by dividing total supplier purchases by your average accounts payable during a specific period. This metric reveals how quickly your organization pays its creditors. A high ratio suggests efficient cash management, while a low ratio may indicate liquidity issues or favorable credit terms. It's a vital indicator for assessing your company's short-term liquidity and creditworthiness.
How do I handle inconsistent vendor names in my AP data analysis?
Standardize vendor names using the TRIM function to remove hidden spaces and the UPPER function for case consistency. Inconsistent naming, like "Global Corp" versus "Global Corp.", disrupts spend analysis and results in fragmented reporting. For large datasets, manual cleaning is inefficient. Utilizing automated Data Quality Analysis ensures your vendor master data remains clean without hours of manual intervention, providing a single version of the truth.
Is it safe to analyze sensitive ERP data in a standard Excel sheet?
Storing sensitive financial data in local Excel files creates significant security liabilities. If a device is compromised or a network folder is breached, your vendor bank details are exposed. Browser-side processing offers a safer alternative. It analyzes your data within your secure session without requiring raw file storage on external servers. This approach maintains your organization's privacy while delivering the deep insights you need.
What is the best way to present AP data to a CFO?
Present a high-level summary that focuses on cash flow impact and risk mitigation. CFOs value Executive-Ready Reports that highlight aging trends and potential savings from early-payment discounts. Avoid overwhelming leadership with raw ledger lines. Instead, use clean visuals that show where capital is tied up and how to optimize liquidity. Focus on the "so what" of the data rather than the raw numbers.
How does AI improve accounts payable analysis compared to manual formulas?
AI identifies complex patterns and anomalies that static formulas often miss. Unlike manual Excel logic, an AI Data Analyst doesn't break when your ERP export format changes or a column shifts. It provides predictive insights, such as forecasting future cash requirements, rather than just summarizing past transactions. This shift moves your team away from tedious formula maintenance toward strategic financial oversight.
Do I need to integrate my ERP to use automated analysis tools?
No, you don't need a direct ERP integration to leverage modern automation. The Stratoryn ERP Intelligence Workspace works directly with your existing CSV or Excel exports. This "no-integration" model eliminates IT bottlenecks and allows your finance team to generate deep insights immediately. You simply upload your report and receive processed results in minutes, bypassing the need for complex software implementations.
Frequently asked questions
How do I identify duplicate invoices in an Excel AP export?
You identify duplicate invoices by applying Conditional Formatting to the Invoice Number column. Select your data, navigate to Highlight Cell Rules, and choose Duplicate Values to flag matches instantly. For a more precise audit, use a COUNTIF formula to check for rows where both the vendor ID and invoice amount are identical. Manual checks often fail when invoice numbers have slight variations, so look for patterns rather than exact matches.
What are the most important AP metrics to track in a spreadsheet?
Focus on AP Aging, Vendor Spend Concentration, and Invoice Cycle Time. These metrics provide a clear view of your current liabilities and operational efficiency. You should also monitor your duplicate payment rate to prevent capital leakage. Effective accounts payable data analysis in excel requires a balance between descriptive history and actionable risk metrics that inform your cash flow strategy.
Can I use Excel to calculate accounts payable turnover ratio?
Yes, you calculate the accounts payable turnover ratio by dividing total supplier purchases by your average accounts payable during a specific period. This metric reveals how quickly your organization pays its creditors. A high ratio suggests efficient cash management, while a low ratio may indicate liquidity issues or favorable credit terms. It's a vital indicator for assessing your company's short-term liquidity and creditworthiness.
How do I handle inconsistent vendor names in my AP data analysis?
Standardize vendor names using the TRIM function to remove hidden spaces and the UPPER function for case consistency. Inconsistent naming, like "Global Corp" versus "Global Corp.", disrupts spend analysis and results in fragmented reporting. For large datasets, manual cleaning is inefficient. Utilizing automated Data Quality Analysis ensures your vendor master data remains clean without hours of manual intervention, providing a single version of the truth.
Is it safe to analyze sensitive ERP data in a standard Excel sheet?
Storing sensitive financial data in local Excel files creates significant security liabilities. If a device is compromised or a network folder is breached, your vendor bank details are exposed. Browser-side processing offers a safer alternative. It analyzes your data within your secure session without requiring raw file storage on external servers. This approach maintains your organization's privacy while delivering the deep insights you need.
What is the best way to present AP data to a CFO?
Present a high-level summary that focuses on cash flow impact and risk mitigation. CFOs value Executive-Ready Reports that highlight aging trends and potential savings from early-payment discounts. Avoid overwhelming leadership with raw ledger lines. Instead, use clean visuals that show where capital is tied up and how to optimize liquidity. Focus on the "so what" of the data rather than the raw numbers.
How does AI improve accounts payable analysis compared to manual formulas?
AI identifies complex patterns and anomalies that static formulas often miss. Unlike manual Excel logic, an AI Data Analyst doesn't break when your ERP export format changes or a column shifts. It provides predictive insights, such as forecasting future cash requirements, rather than just summarizing past transactions. This shift moves your team away from tedious formula maintenance toward strategic financial oversight.
Do I need to integrate my ERP to use automated analysis tools?
No, you don't need a direct ERP integration to leverage modern automation. The Stratoryn ERP Intelligence Workspace works directly with your existing CSV or Excel exports. This "no-integration" model eliminates IT bottlenecks and allows your finance team to generate deep insights immediately. You simply upload your report and receive processed results in minutes, bypassing the need for complex software implementations.
- accounts payable data analysis in excel
- Accounts Payable
- Excel
- Data Analysis
- Financial Reporting
- AP Automation
- Month-End Close
- Vendor Spend Analysis
- ERP
- ap analysis in excel
- accounts payable reporting
- vendor spend analysis
- duplicate payment detection
- ap aging report excel
- erp data analysis